プロンプト
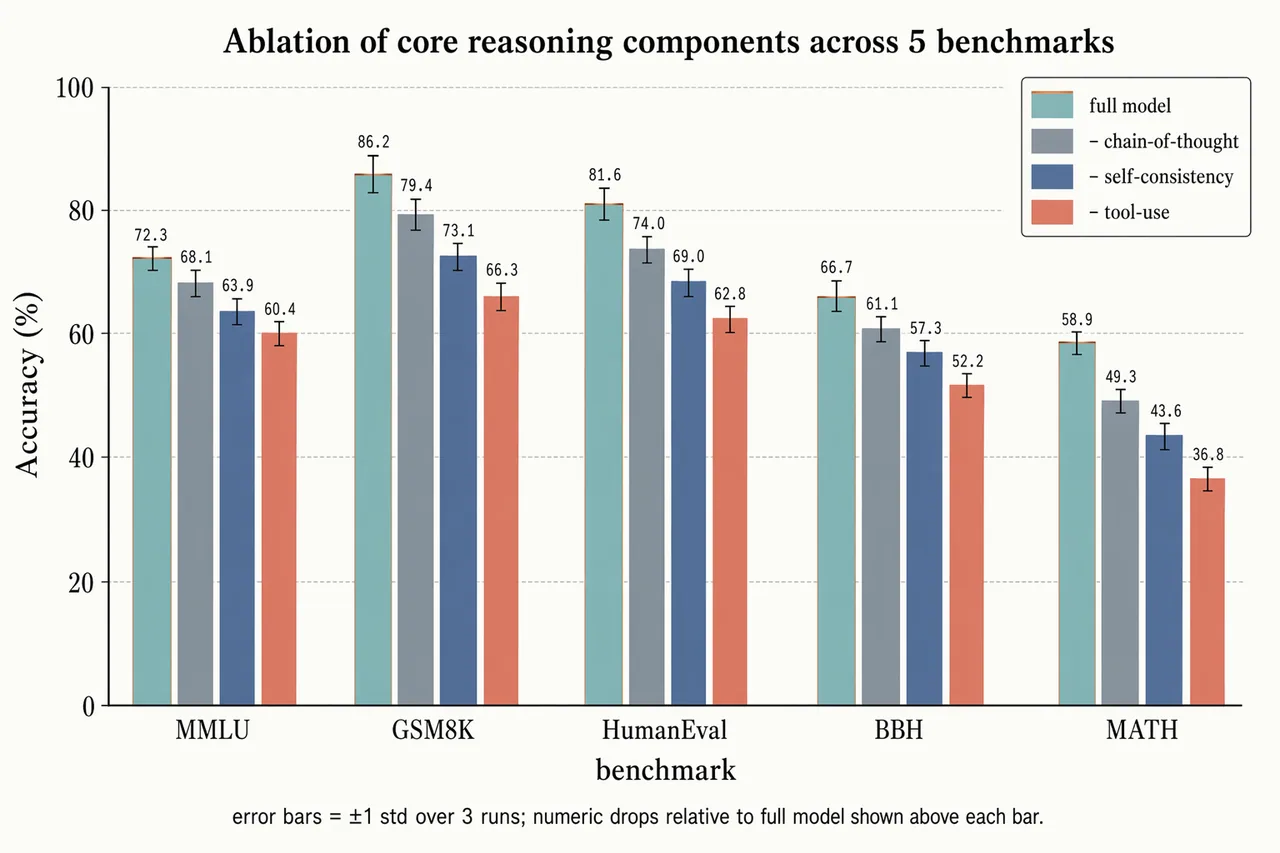
Landscape 16:9 grouped-bar ablation chart.

X-axis: 5 benchmark groups "MMLU", "GSM8K", "HumanEval", "BBH", "MATH". Y-axis "Accuracy (%)" with ticks "0", "20", "40", "60", "80", "100".

Each group has 4 bars side-by-side:
(1) "full model" — dusty-teal with thin warm-copper top outline
(2) "– chain-of-thought" — slate gray
(3) "– self-consistency" — muted navy
(4) "– tool-use" — soft terracotta

Thin black ±1σ error bars on each; numeric label above each bar in monospace. Faint horizontal gridlines. Legend box top-right.

Title: "Ablation of core reasoning components across 5 benchmarks". Subtitle: "error bars = ±1 std over 3 runs; numeric drops relative to full model shown above each bar."
日本語訳
横向き 16:9 のグループ化棒グラフによるアブレーション図。

X 軸:5 つのベンチマークグループ「MMLU」「GSM8K」「HumanEval」「BBH」「MATH」。Y 軸「Accuracy (%)」、ティック「0」「20」「40」「60」「80」「100」。

各グループに 4 本の棒を横並びで配置:
(1)「full model」— くすんだティール、上端に細いウォームカッパーの輪郭
(2)「– chain-of-thought」— スレートグレー
(3)「– self-consistency」— 落ち着いたネイビー
(4)「– tool-use」— 柔らかなテラコッタ

各棒に細い黒の ±1σ エラーバー、棒の上に等幅フォントの数値ラベル。淡い水平グリッド線。右上に凡例ボックス。

タイトル:「Ablation of core reasoning components across 5 benchmarks」。サブタイトル:「error bars = ±1 std over 3 runs; numeric drops relative to full model shown above each bar.」