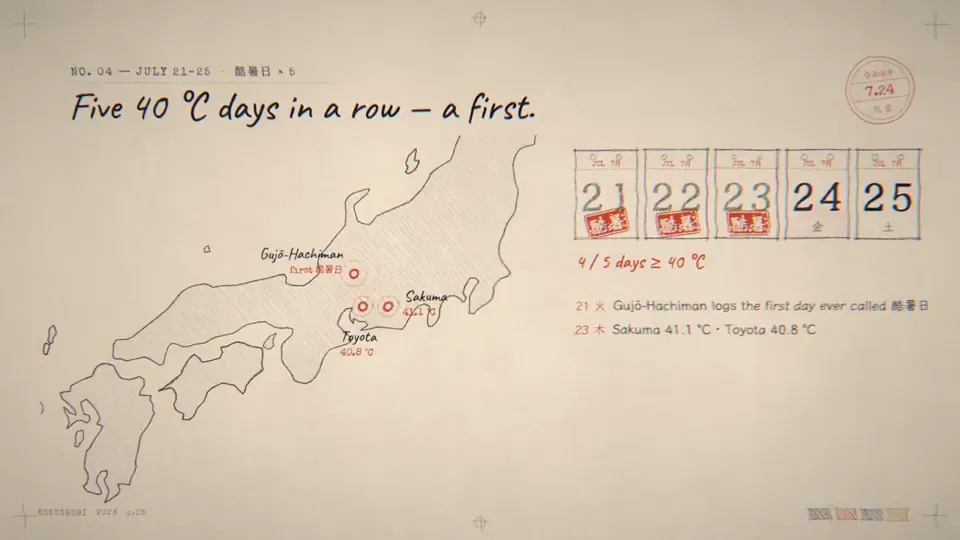
All right, this is an empty repo. Make me a 3-minute animated visualization using JavaScript, or you can do it in TypeScript if you want, about Japan's hot weather in 2026. Pull some online data to see why it was hot and how it compares to other years. I really want the animation to be visually appealing. I wanted to use a hand-drawn pencil style with a little bit of tasteful chromatic aberration. And maybe a bit of a pastiche look but it's supposed to look really, really cool. Also, use a JavaScript synthesizer to make a melody for this visualization that goes along with the theme.
한국어 번역
좋아, 이건 빈 저장소야. JavaScript로, 원한다면 TypeScript로 해도 되는데, 2026년 일본의 더위에 관한 3분짜리 애니메이션 시각화를 만들어줘. 온라인 데이터를 좀 가져와서 왜 더웠는지, 다른 해와 비교하면 어떤지 알아봐. 애니메이션이 시각적으로 정말 매력적이었으면 해. 손으로 그린 연필 스타일에 감각적인 색수차를 조금 넣고 싶었고, 약간 파스티슈 느낌도 있지만 정말, 정말 멋져 보여야 해. 그리고 JavaScript 신시사이저로 이 시각화의 주제에 어울리는 멜로디를 만들어줘.