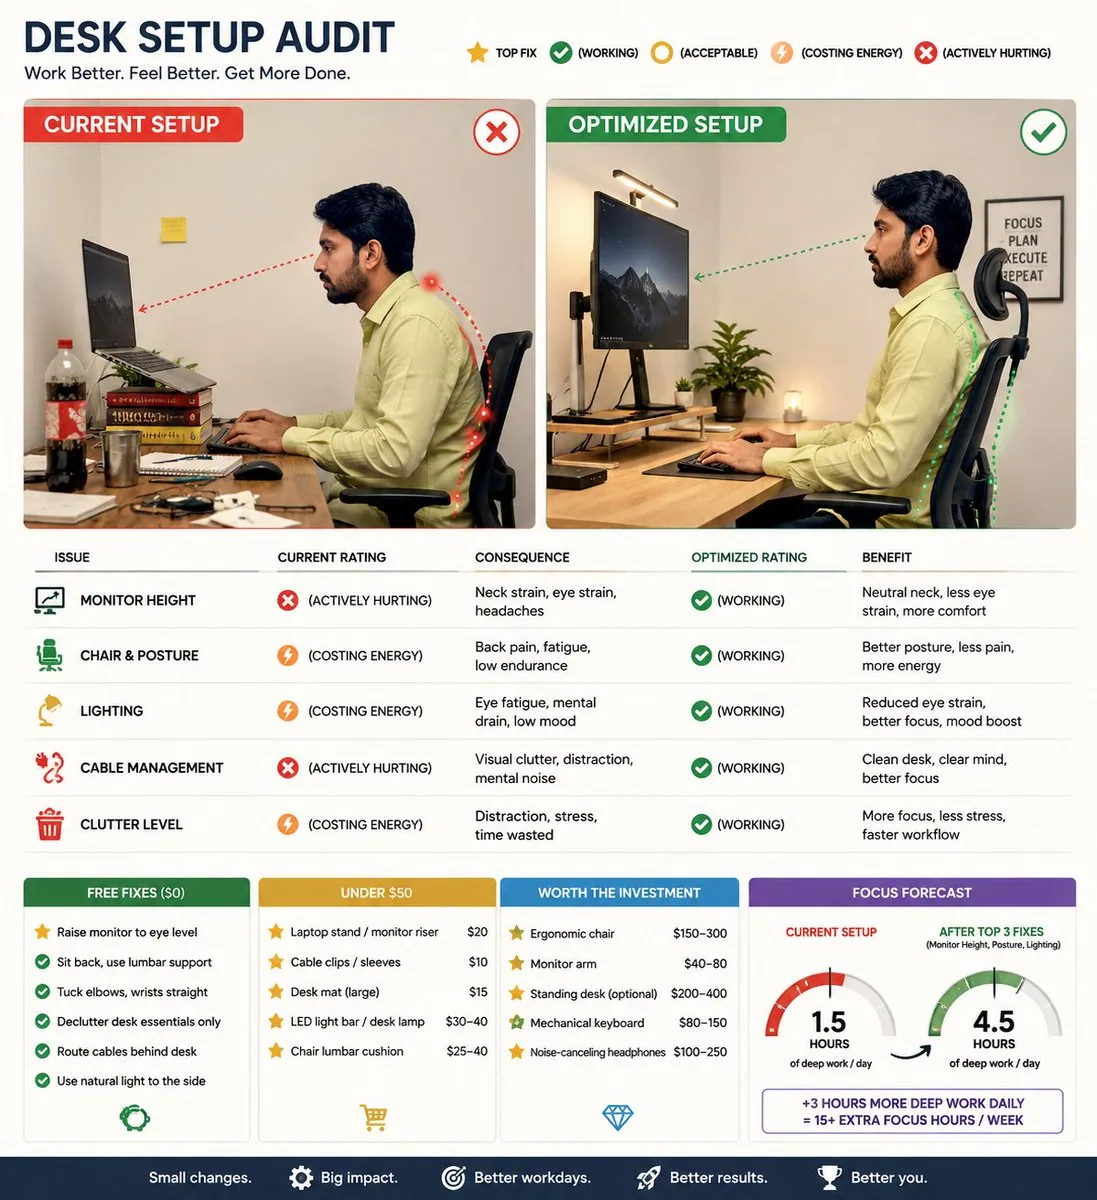
Create a visual-first, editorial-style infographic auditing the desk setup in the attached photo. Show a side-by-side of current vs. optimized setup with annotations on monitor height, chair position, lighting, cable management, and clutter. Rate each issue with symbols like Top Fix, (working), (acceptable), (costing energy), and (actively hurting), tying each to a consequence like back pain, eye strain, or focus loss. Rank fixes by impact and group them into free fixes, under $50, and worth the investment. Include a Focus Forecast gauge predicting daily deep work hours possible with the current setup vs. after the top 3 fixes. Keep it clean, minimal text, no paragraphs.
한국어 번역
첨부된 사진 속 데스크 셋업을 진단하는 비주얼 중심의 에디토리얼 스타일 인포그래픽을 만들어 주세요. 현재 셋업과 최적화된 셋업을 나란히 비교하고 모니터 높이, 의자 위치, 조명, 케이블 정리, 어수선함에 대한 주석을 달아 주세요. 각 문제를 최우선 수정, (작동 중), (허용 가능), (에너지 소모), (적극적으로 해롭고) 같은 기호로 평가하고, 각각을 허리 통증, 눈의 피로, 집중력 저하 같은 결과와 연결하세요. 수정 사항을 영향도 순으로 순위를 매기고 무료 수정, $50 미만, 투자할 가치가 있는 항목으로 묶으세요. 현재 셋업과 상위 3가지 수정 후 가능한 일일 딥 워크 시간을 예측하는 집중력 예측 게이지를 포함하세요. 깔끔하게 유지하고 텍스트는 최소화하며 문단은 쓰지 마세요.