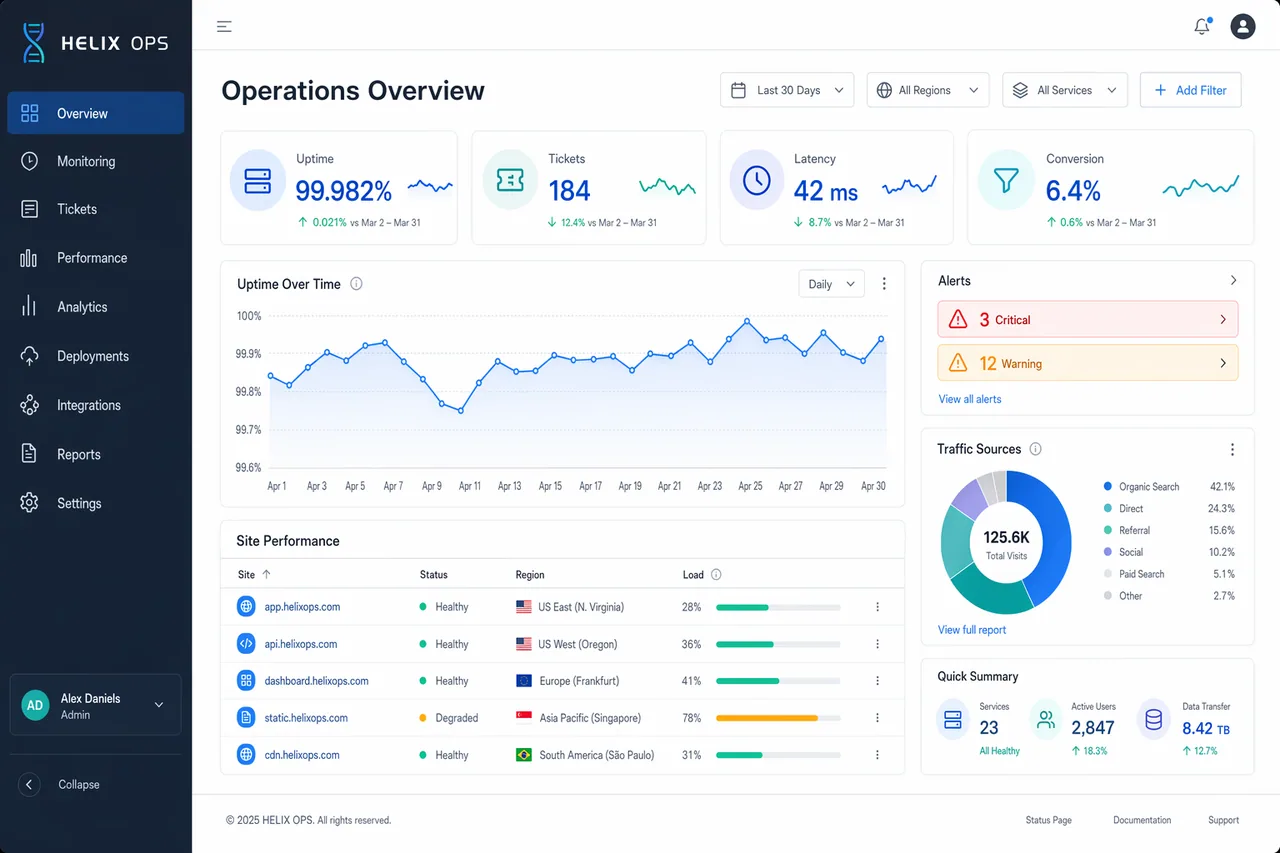
Create a high-end desktop SaaS analytics dashboard mockup for a fictional platform named HELIX OPS, displayed on a 16:10 monitor canvas at 1600x1000. Use a cool palette of slate, cobalt blue, teal, pale gray, and white, with subtle glass panels and tight grid alignment. The layout should include a left sidebar, top filter bar, KPI cards, line charts, data table, and alert panel. Use crisp typography and correct labels. Include in-image text: "HELIX OPS", "Operations Overview", "Last 30 Days", "Uptime 99.982%", "Tickets 184", "Latency 42 ms", and "Conversion 6.4%". Show a line chart labeled "Apr 1" through "Apr 30", a donut chart titled "Traffic Sources", and a table with columns "Site", "Status", "Region", and "Load". Add alert pills reading "3 Critical" and "12 Warning". Composition should feel realistic and presentation-ready, with clean hierarchy, precise spacing, balanced negative space, and ultra-sharp dashboard UI rendering.
한국어 번역
HELIX OPS라는 가상의 플랫폼을 위한 하이엔드 데스크톱 SaaS 분석 대시보드 목업을 만드세요. 16:10 모니터 캔버스 1600x1000에 표시합니다. 슬레이트, 코발트 블루, 틸, 옅은 그레이, 화이트의 쿨한 팔레트를 사용하고 은은한 글래스 패널과 촘촘한 그리드 정렬을 살리세요. 레이아웃에는 왼쪽 사이드바, 상단 필터 바, KPI 카드, 라인 차트, 데이터 테이블, 경고 패널이 포함되어야 합니다. 또렷한 타이포그래피와 정확한 라벨을 사용하세요. 이미지 내 텍스트 포함: "HELIX OPS", "Operations Overview", "Last 30 Days", "Uptime 99.982%", "Tickets 184", "Latency 42 ms", "Conversion 6.4%". "Apr 1"부터 "Apr 30"까지 표기된 라인 차트, "Traffic Sources"라는 제목의 도넛 차트, "Site", "Status", "Region", "Load" 열이 있는 테이블을 보여주세요. "3 Critical"과 "12 Warning"이라고 적힌 경고 알약을 추가하세요. 구도는 사실적이고 프레젠테이션에 바로 쓸 수 있는 느낌이어야 하며, 깔끔한 위계, 정확한 간격, 균형 잡힌 여백, 초선명 대시보드 UI 렌더링을 갖추세요.