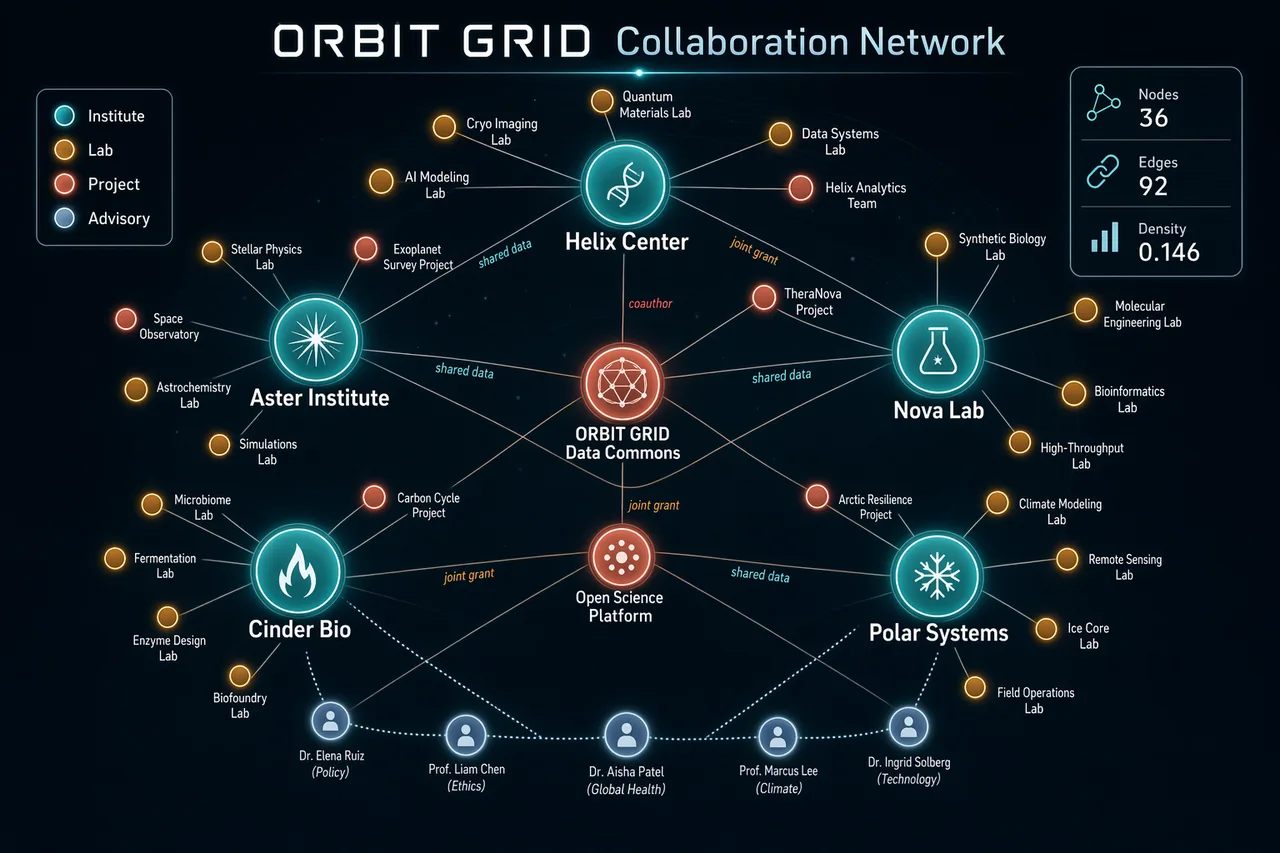
Generate a sophisticated network graph visualization on a dark charcoal canvas showing collaborations across a fictional research consortium called ORBIT GRID. Use glowing node colors in teal, amber, coral, pale blue, and white, with fine connecting lines and clean labels. The composition should be balanced, readable, and intentionally designed rather than random. Include a title in crisp text reading "ORBIT GRID Collaboration Network" and a legend with "Institute", "Lab", "Project", and "Advisory". Show approximately 36 nodes, with larger hubs labeled "Helix Center", "Nova Lab", "Aster Institute", "Cinder Bio", and "Polar Systems". Add edge labels sparingly, such as "shared data", "joint grant", and "coauthor". Include a right-side stats card reading "Nodes 36", "Edges 92", and "Density 0.146". Emphasize clean hierarchy, accurate node-label placement, anti-overlap spacing, subtle depth, and crisp typography suited for a polished technical visualization generated by gpt-image-2.
한국어 번역
ORBIT GRID라는 가상 연구 컨소시엄의 협업 관계를 보여주는 정교한 네트워크 그래프 시각화를 짙은 차콜 캔버스 위에 생성하라. 청록, 앰버, 산호, 옅은 파랑, 흰색의 빛나는 노드 색상을 사용하고, 가는 연결선과 깔끔한 라벨을 넣는다. 구도는 무작위가 아니라 균형 잡히고 읽기 쉬우며 의도적으로 설계된 느낌이어야 한다. 선명한 텍스트로 "ORBIT GRID Collaboration Network"라는 제목과 "Institute", "Lab", "Project", "Advisory"가 포함된 범례를 넣는다. 약 36개의 노드를 표시하고, 더 큰 허브에는 "Helix Center", "Nova Lab", "Aster Institute", "Cinder Bio", "Polar Systems" 라벨을 붙인다. "shared data", "joint grant", "coauthor" 같은 간선 라벨을 드물게 추가한다. 오른쪽에는 "Nodes 36", "Edges 92", "Density 0.146"이라고 적힌 통계 카드를 넣는다. 깔끔한 위계, 정확한 노드-라벨 배치, 겹침 방지 간격, 은은한 깊이감, 그리고 gpt-image-2로 생성된 세련된 기술 시각화에 어울리는 선명한 타이포그래피를 강조한다.