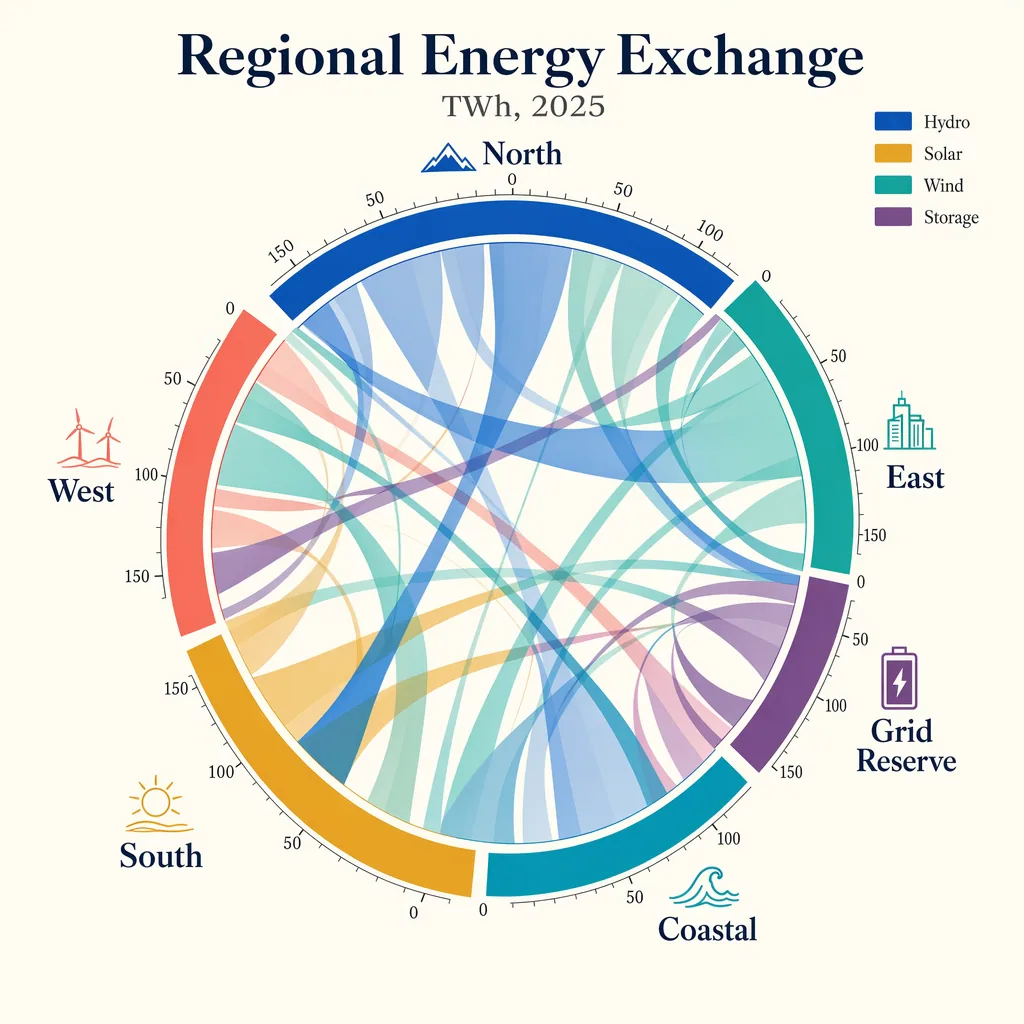
Create a publication-quality chord diagram visualizing fictional regional energy flows in 2025. Use a bright ivory background with a centered circular composition and a harmonious palette of cobalt, teal, ochre, coral, plum, and graphite. The diagram should feel mathematically precise, with clean arcs, semi-transparent ribbons, and highly legible labels. Add a title block with the in-image text "Regional Energy Exchange" and subtitle "TWh, 2025". Label outer segments "North", "South", "East", "West", "Coastal", and "Grid Reserve". Include a small legend reading "Hydro", "Solar", "Wind", and "Storage". Place tiny numeric ticks around the ring at "0", "50", "100", and "150". Use ribbon thickness to imply volume, but keep the composition readable and elegant. Prioritize crisp labels, clear hierarchy, accurate geometry, balanced white space, and a refined data-journalism aesthetic rather than generic infographic styling.
한국어 번역
2025년 가상의 지역별 에너지 흐름을 시각화한 출판 품질의 코드 다이어그램을 만들어라. 밝은 아이보리 배경에 중앙 원형 구도를 사용하고 코발트, 청록, 오커, 산호, 플럼, 흑연의 조화로운 팔레트를 쓴다. 다이어그램은 수학적으로 정밀하게 느껴져야 하며, 깔끔한 호, 반투명 리본, 매우 읽기 쉬운 라벨을 갖춘다. 이미지 내 텍스트 "Regional Energy Exchange"와 부제 "TWh, 2025"가 있는 제목 블록을 추가한다. 바깥 세그먼트 라벨은 "North", "South", "East", "West", "Coastal", "Grid Reserve"로 표기한다. "Hydro", "Solar", "Wind", "Storage"를 읽는 작은 범례를 포함한다. 링 둘레에 "0", "50", "100", "150"의 작은 숫자 눈금을 배치한다. 리본 두께로 규모를 암시하되 구도는 읽기 쉽고 우아하게 유지한다. 일반적인 인포그래픽 스타일이 아니라 선명한 라벨, 명확한 위계, 정확한 기하학, 균형 잡힌 여백, 세련된 데이터 저널리즘 미학을 우선한다.