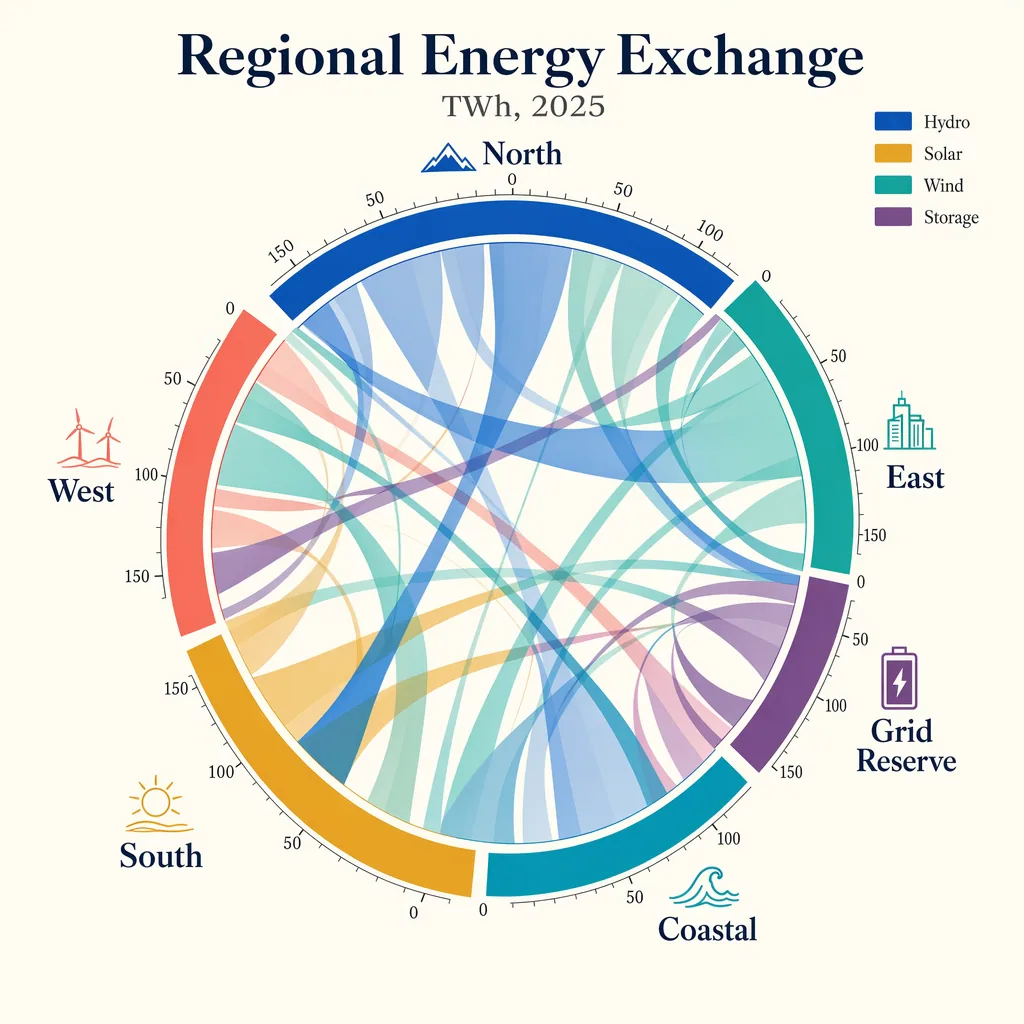
Create a publication-quality chord diagram visualizing fictional regional energy flows in 2025. Use a bright ivory background with a centered circular composition and a harmonious palette of cobalt, teal, ochre, coral, plum, and graphite. The diagram should feel mathematically precise, with clean arcs, semi-transparent ribbons, and highly legible labels. Add a title block with the in-image text "Regional Energy Exchange" and subtitle "TWh, 2025". Label outer segments "North", "South", "East", "West", "Coastal", and "Grid Reserve". Include a small legend reading "Hydro", "Solar", "Wind", and "Storage". Place tiny numeric ticks around the ring at "0", "50", "100", and "150". Use ribbon thickness to imply volume, but keep the composition readable and elegant. Prioritize crisp labels, clear hierarchy, accurate geometry, balanced white space, and a refined data-journalism aesthetic rather than generic infographic styling.