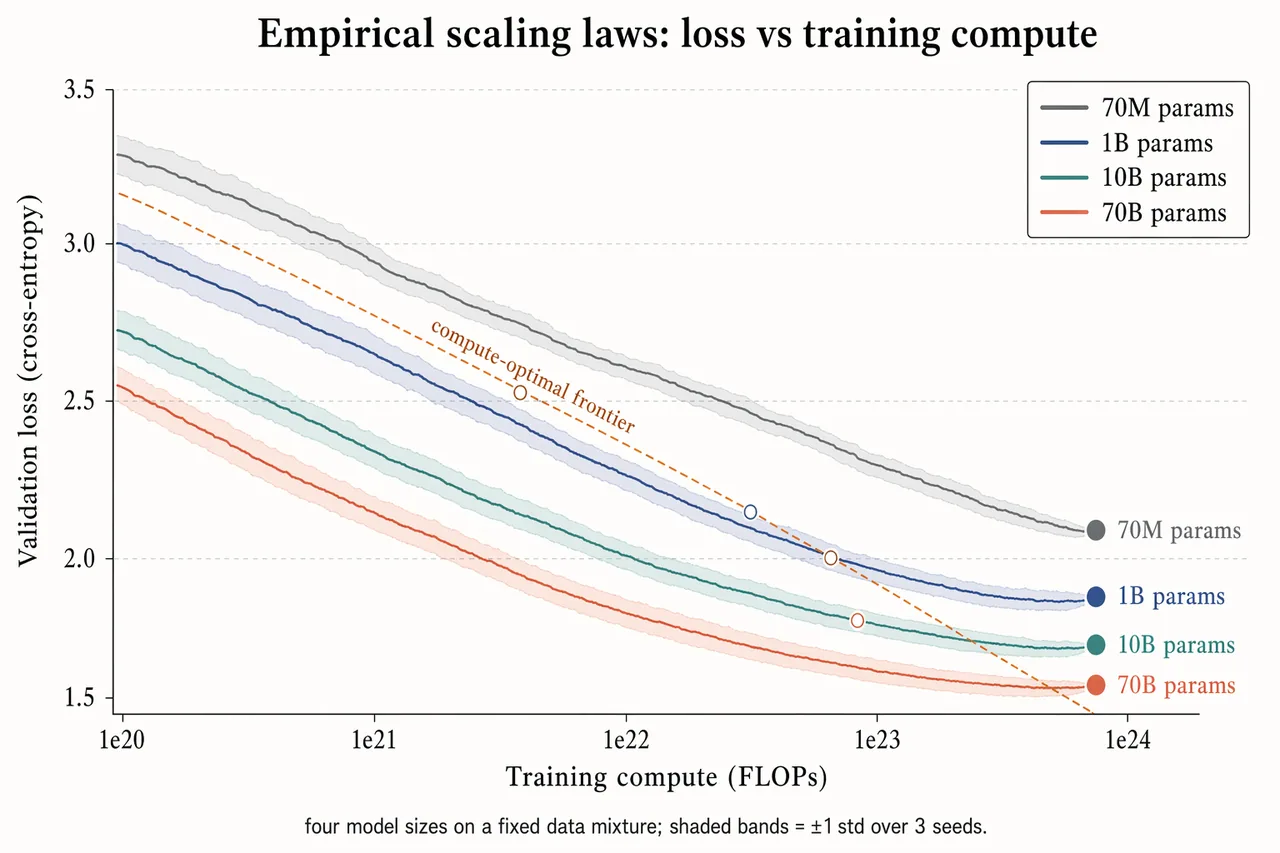
Landscape 16:9 log-scaled plot of training loss vs compute, four curves for different model sizes.

X-axis "Training compute (FLOPs)" with log ticks "1e20", "1e21", "1e22", "1e23", "1e24". Y-axis "Validation loss (cross-entropy)" with linear decreasing ticks "3.5", "3.0", "2.5", "2.0", "1.5".

Four descending curves with ±1σ shaded bands, labels near tails:
"70M params" (slate gray), "1B params" (muted navy), "10B params" (dusty teal), "70B params" (soft terracotta).

Warm-copper dashed diagonal line labeled "compute-optimal frontier"; open circles at isoflop crossover points. Legend box top-right.

Title: "Empirical scaling laws: loss vs training compute". Subtitle: "four model sizes on a fixed data mixture; shaded bands = ±1 std over 3 seeds."
中文翻譯
橫向 16:9 的對數座標圖,繪製訓練損失 vs 計算量,四條曲線代表不同的模型規模。

X 軸“訓練計算量 (FLOPs)”,對數刻度爲“1e20”、“1e21”、“1e22”、“1e23”、“1e24”。Y 軸“驗證損失 (交叉熵)”,線性遞減刻度爲“3.5”、“3.0”、“2.5”、“2.0”、“1.5”。

四條下降曲線,帶 ±1σ 陰影帶,曲線尾端附近標註:
“70M 參數”(石板灰)、“1B 參數”(低飽和藏青)、“10B 參數”(灰青色)、“70B 參數”(柔和赤陶色)。

暖銅色虛線對角線,標註爲“計算最優前沿”;在等 FLOP 交叉點處爲空心圓點。右上角圖例框。

標題:“經驗縮放定律:損失 vs 訓練計算量”。副標題:“四組模型規模在同一固定數據配比上;陰影帶 = 3 個隨機種子上的 ±1 標準差。”