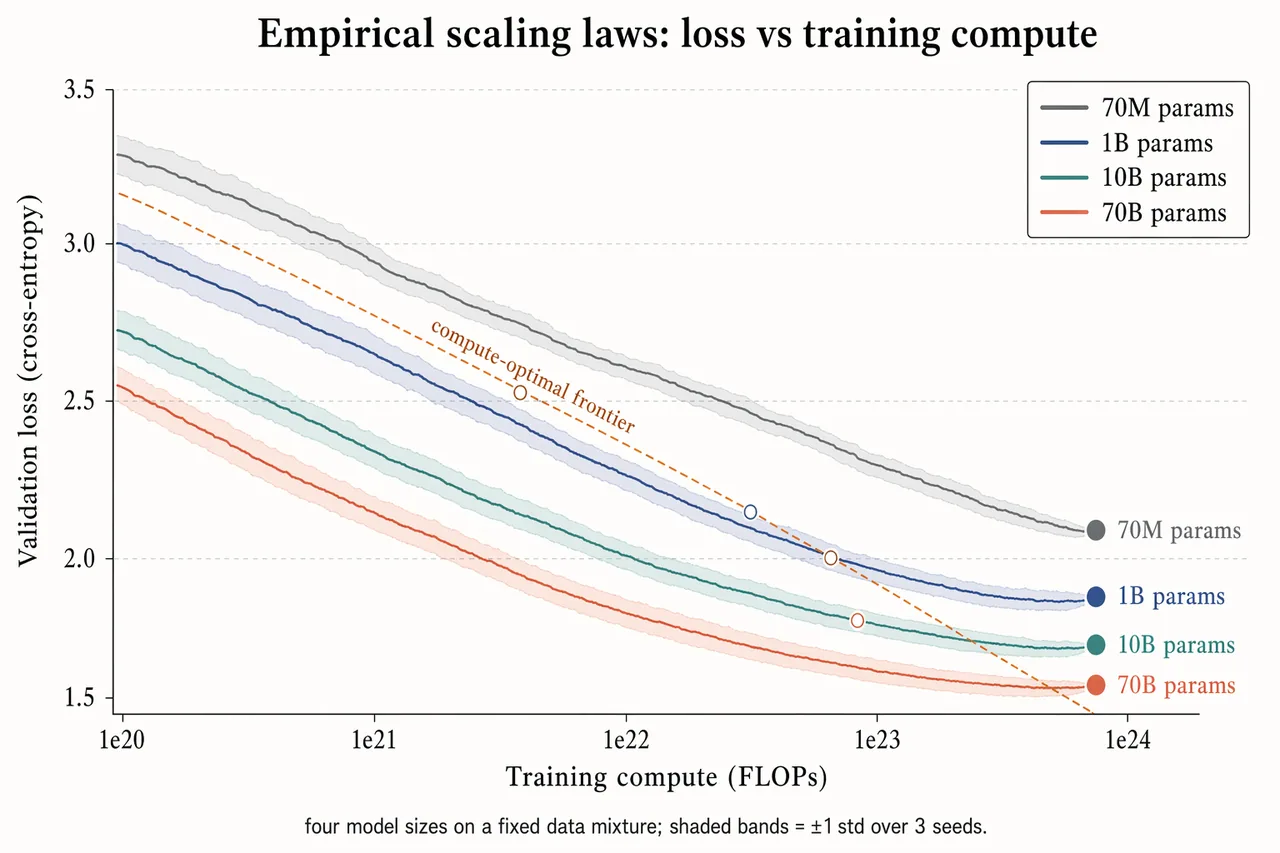
Landscape 16:9 log-scaled plot of training loss vs compute, four curves for different model sizes.

X-axis "Training compute (FLOPs)" with log ticks "1e20", "1e21", "1e22", "1e23", "1e24". Y-axis "Validation loss (cross-entropy)" with linear decreasing ticks "3.5", "3.0", "2.5", "2.0", "1.5".

Four descending curves with ±1σ shaded bands, labels near tails:
"70M params" (slate gray), "1B params" (muted navy), "10B params" (dusty teal), "70B params" (soft terracotta).

Warm-copper dashed diagonal line labeled "compute-optimal frontier"; open circles at isoflop crossover points. Legend box top-right.

Title: "Empirical scaling laws: loss vs training compute". Subtitle: "four model sizes on a fixed data mixture; shaded bands = ±1 std over 3 seeds."
中文译文
横向 16:9 的对数坐标图,绘制训练损失 vs 计算量,四条曲线代表不同的模型规模。

X 轴“训练计算量 (FLOPs)”,对数刻度为“1e20”、“1e21”、“1e22”、“1e23”、“1e24”。Y 轴“验证损失 (交叉熵)”,线性递减刻度为“3.5”、“3.0”、“2.5”、“2.0”、“1.5”。

四条下降曲线,带 ±1σ 阴影带,曲线尾端附近标注:
“70M 参数”(石板灰)、“1B 参数”(低饱和藏青)、“10B 参数”(灰青色)、“70B 参数”(柔和赤陶色)。

暖铜色虚线对角线,标注为“计算最优前沿”;在等 FLOP 交叉点处为空心圆点。右上角图例框。

标题:“经验缩放定律:损失 vs 训练计算量”。副标题:“四组模型规模在同一固定数据配比上;阴影带 = 3 个随机种子上的 ±1 标准差。”