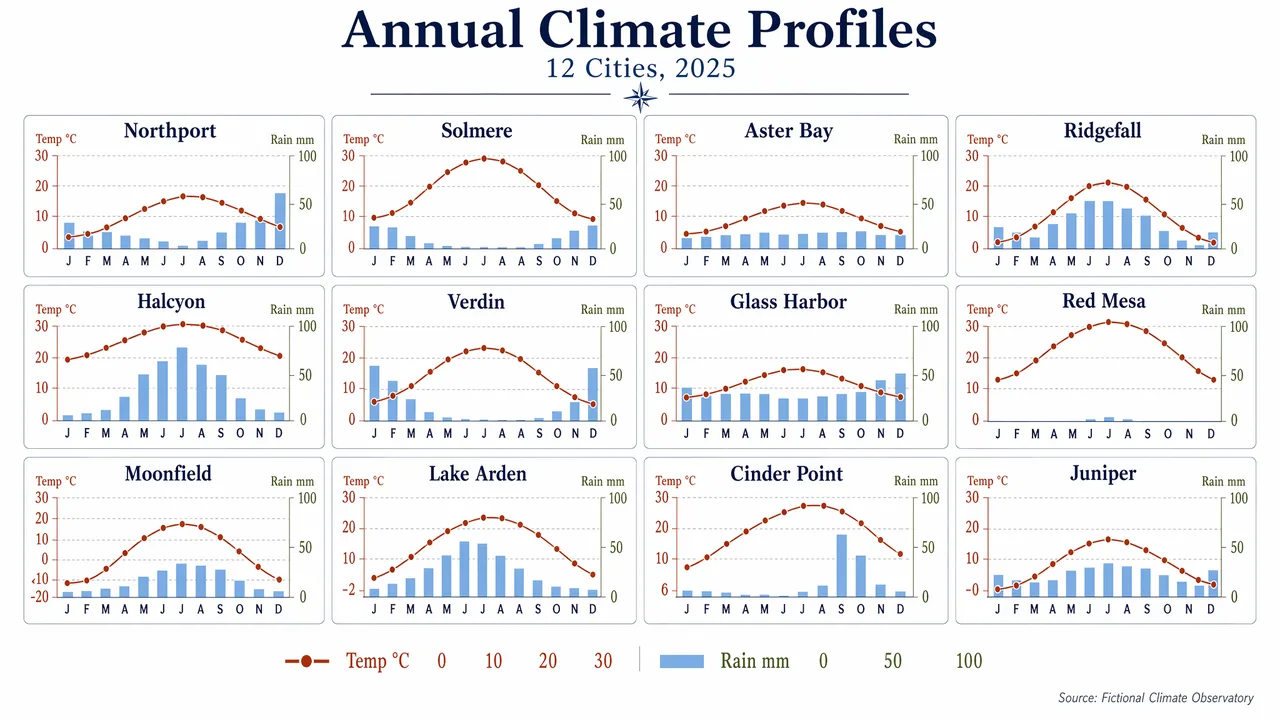
Produce a clean editorial data visualization poster showing a 4x3 small-multiples grid of monthly climate charts for 12 fictional cities. Use a white background, generous margins, and a restrained palette of navy, rust, sky blue, olive, and charcoal. Each mini-panel should contain a temperature line and precipitation bars with consistent axes and ultra-legible labels. Include a title block with the in-image text "Annual Climate Profiles" and subtitle "12 Cities, 2025". Label panels "Northport", "Solmere", "Aster Bay", "Ridgefall", "Halcyon", "Verdin", "Glass Harbor", "Red Mesa", "Moonfield", "Lake Arden", "Cinder Point", and "Juniper". Use month labels "J F M A M J J A S O N D" and axis labels "Temp °C" and "Rain mm". Add numeric legend values "0", "10", "20", "30", and "100". Keep the composition highly structured, scientifically clear, and visually elegant, with crisp typography, aligned scales, and publication-grade chart rendering.
日本語訳
12の架空都市の月別気候チャートを4x3のスモールマルチプル・グリッドで示す、クリーンなエディトリアル・データビジュアライゼーション・ポスターを作成する。白い背景、ゆったりした余白、そしてネイビー、ラスト、スカイブルー、オリーブ、チャコールの抑制されたパレットを使う。各ミニパネルには気温の折れ線と降水量の棒グラフを、統一された軸と極めて読みやすいラベルで含める。タイトルブロックには画像内テキスト "Annual Climate Profiles"、サブタイトル "12 Cities, 2025" を含める。パネルのラベルは "Northport" "Solmere" "Aster Bay" "Ridgefall" "Halcyon" "Verdin" "Glass Harbor" "Red Mesa" "Moonfield" "Lake Arden" "Cinder Point" "Juniper"。月ラベル "J F M A M J J A S O N D"、軸ラベル "Temp °C" と "Rain mm" を使う。数値の凡例 "0" "10" "20" "30" "100" を加える。構図は高度に構造化され、科学的に明快で、視覚的にエレガントに保ち、鮮明なタイポグラフィ、揃ったスケール、出版品質のチャートレンダリングを実現する。