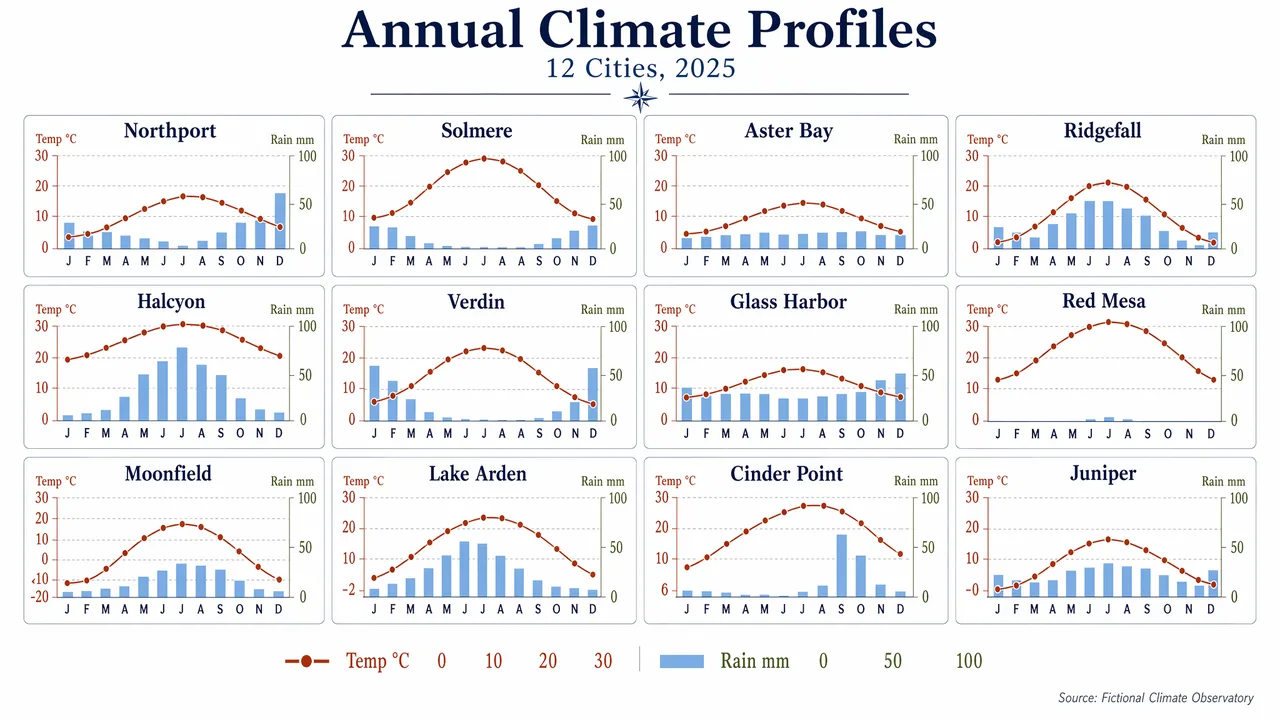
Produce a clean editorial data visualization poster showing a 4x3 small-multiples grid of monthly climate charts for 12 fictional cities. Use a white background, generous margins, and a restrained palette of navy, rust, sky blue, olive, and charcoal. Each mini-panel should contain a temperature line and precipitation bars with consistent axes and ultra-legible labels. Include a title block with the in-image text "Annual Climate Profiles" and subtitle "12 Cities, 2025". Label panels "Northport", "Solmere", "Aster Bay", "Ridgefall", "Halcyon", "Verdin", "Glass Harbor", "Red Mesa", "Moonfield", "Lake Arden", "Cinder Point", and "Juniper". Use month labels "J F M A M J J A S O N D" and axis labels "Temp °C" and "Rain mm". Add numeric legend values "0", "10", "20", "30", and "100". Keep the composition highly structured, scientifically clear, and visually elegant, with crisp typography, aligned scales, and publication-grade chart rendering.
中文翻譯
製作一張簡潔的編輯風格數據可視化海報,展示 12 座虛構城市的月度氣候圖表 4x3 小倍數網格。使用白色背景、寬裕的頁邊距,以及剋制的配色:藏青、鐵鏽紅、天藍、橄欖綠與炭黑。每個小面板應包含一條氣溫折線與柱狀降水量,座標軸保持一致,標籤極清晰易讀。包含一個標題區,畫面內文字爲 "Annual Climate Profiles",副標題爲 "12 Cities, 2025"。爲面板標註 "Northport"、"Solmere"、"Aster Bay"、"Ridgefall"、"Halcyon"、"Verdin"、"Glass Harbor"、"Red Mesa"、"Moonfield"、"Lake Arden"、"Cinder Point" 和 "Juniper"。使用月份標籤 "J F M A M J J A S O N D",座標軸標籤 "Temp °C" 與 "Rain mm"。添加數值圖例 "0"、"10"、"20"、"30" 和 "100"。整體構圖要高度結構化、科學清晰且視覺優雅,字體銳利、刻度對齊,具備出版級圖表的渲染質量。