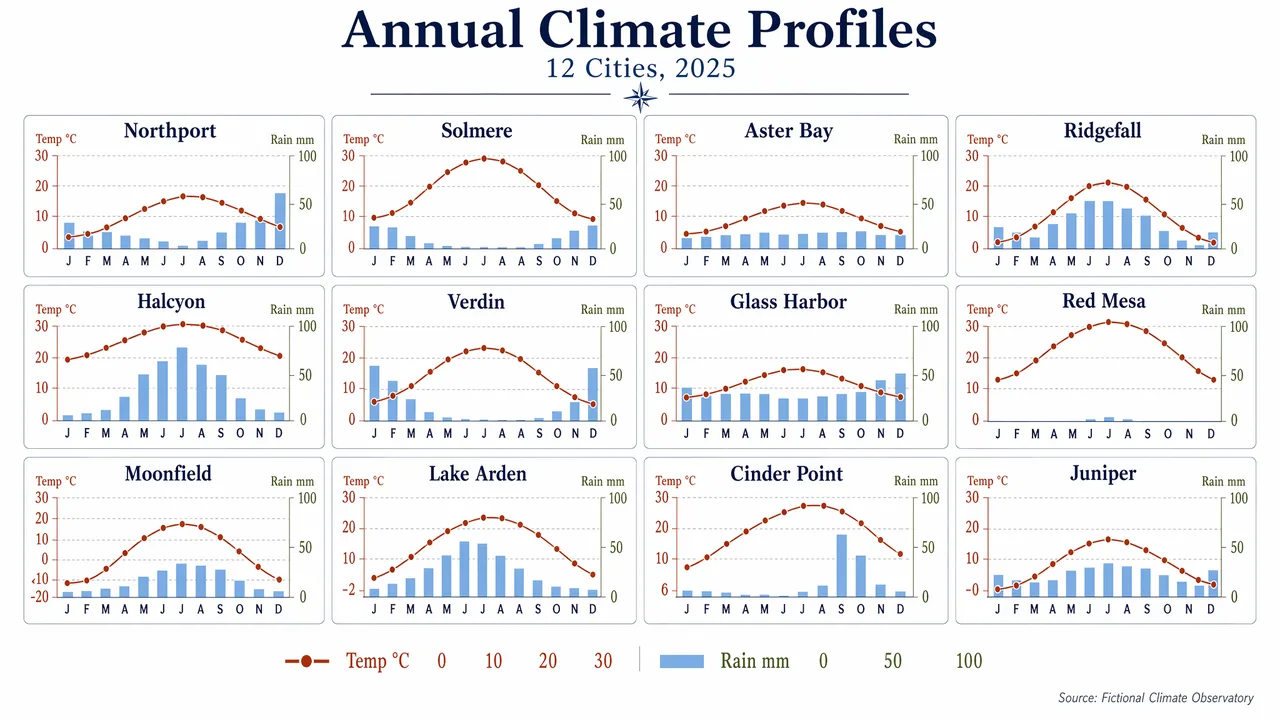
Produce a clean editorial data visualization poster showing a 4x3 small-multiples grid of monthly climate charts for 12 fictional cities. Use a white background, generous margins, and a restrained palette of navy, rust, sky blue, olive, and charcoal. Each mini-panel should contain a temperature line and precipitation bars with consistent axes and ultra-legible labels. Include a title block with the in-image text "Annual Climate Profiles" and subtitle "12 Cities, 2025". Label panels "Northport", "Solmere", "Aster Bay", "Ridgefall", "Halcyon", "Verdin", "Glass Harbor", "Red Mesa", "Moonfield", "Lake Arden", "Cinder Point", and "Juniper". Use month labels "J F M A M J J A S O N D" and axis labels "Temp °C" and "Rain mm". Add numeric legend values "0", "10", "20", "30", and "100". Keep the composition highly structured, scientifically clear, and visually elegant, with crisp typography, aligned scales, and publication-grade chart rendering.
中文译文
制作一张简洁的编辑风格数据可视化海报,展示 12 座虚构城市的月度气候图表 4x3 小倍数网格。使用白色背景、宽裕的页边距,以及克制的配色:藏青、铁锈红、天蓝、橄榄绿与炭黑。每个小面板应包含一条气温折线与柱状降水量,坐标轴保持一致,标签极清晰易读。包含一个标题区,画面内文字为 "Annual Climate Profiles",副标题为 "12 Cities, 2025"。为面板标注 "Northport"、"Solmere"、"Aster Bay"、"Ridgefall"、"Halcyon"、"Verdin"、"Glass Harbor"、"Red Mesa"、"Moonfield"、"Lake Arden"、"Cinder Point" 和 "Juniper"。使用月份标签 "J F M A M J J A S O N D",坐标轴标签 "Temp °C" 与 "Rain mm"。添加数值图例 "0"、"10"、"20"、"30" 和 "100"。整体构图要高度结构化、科学清晰且视觉优雅,字体锐利、刻度对齐,具备出版级图表的渲染质量。